Using simulation to explore mine electrification strategies
The mining industry's journey to net zero is in full swing. Mine operators are well into planning how they'll reduce their carbon footpring to net zero by the year 2050. The task isn't a small one, with the mining industry contributing as much as 2-3% of the global CO2 emissions. But it turns out that a significant chuck the emissions produced by mines comes from diesel-fulled haulage fleets, which makes the electrification of these vehicles the "low-hanging fruit" of a mine's decarbonisation journey.
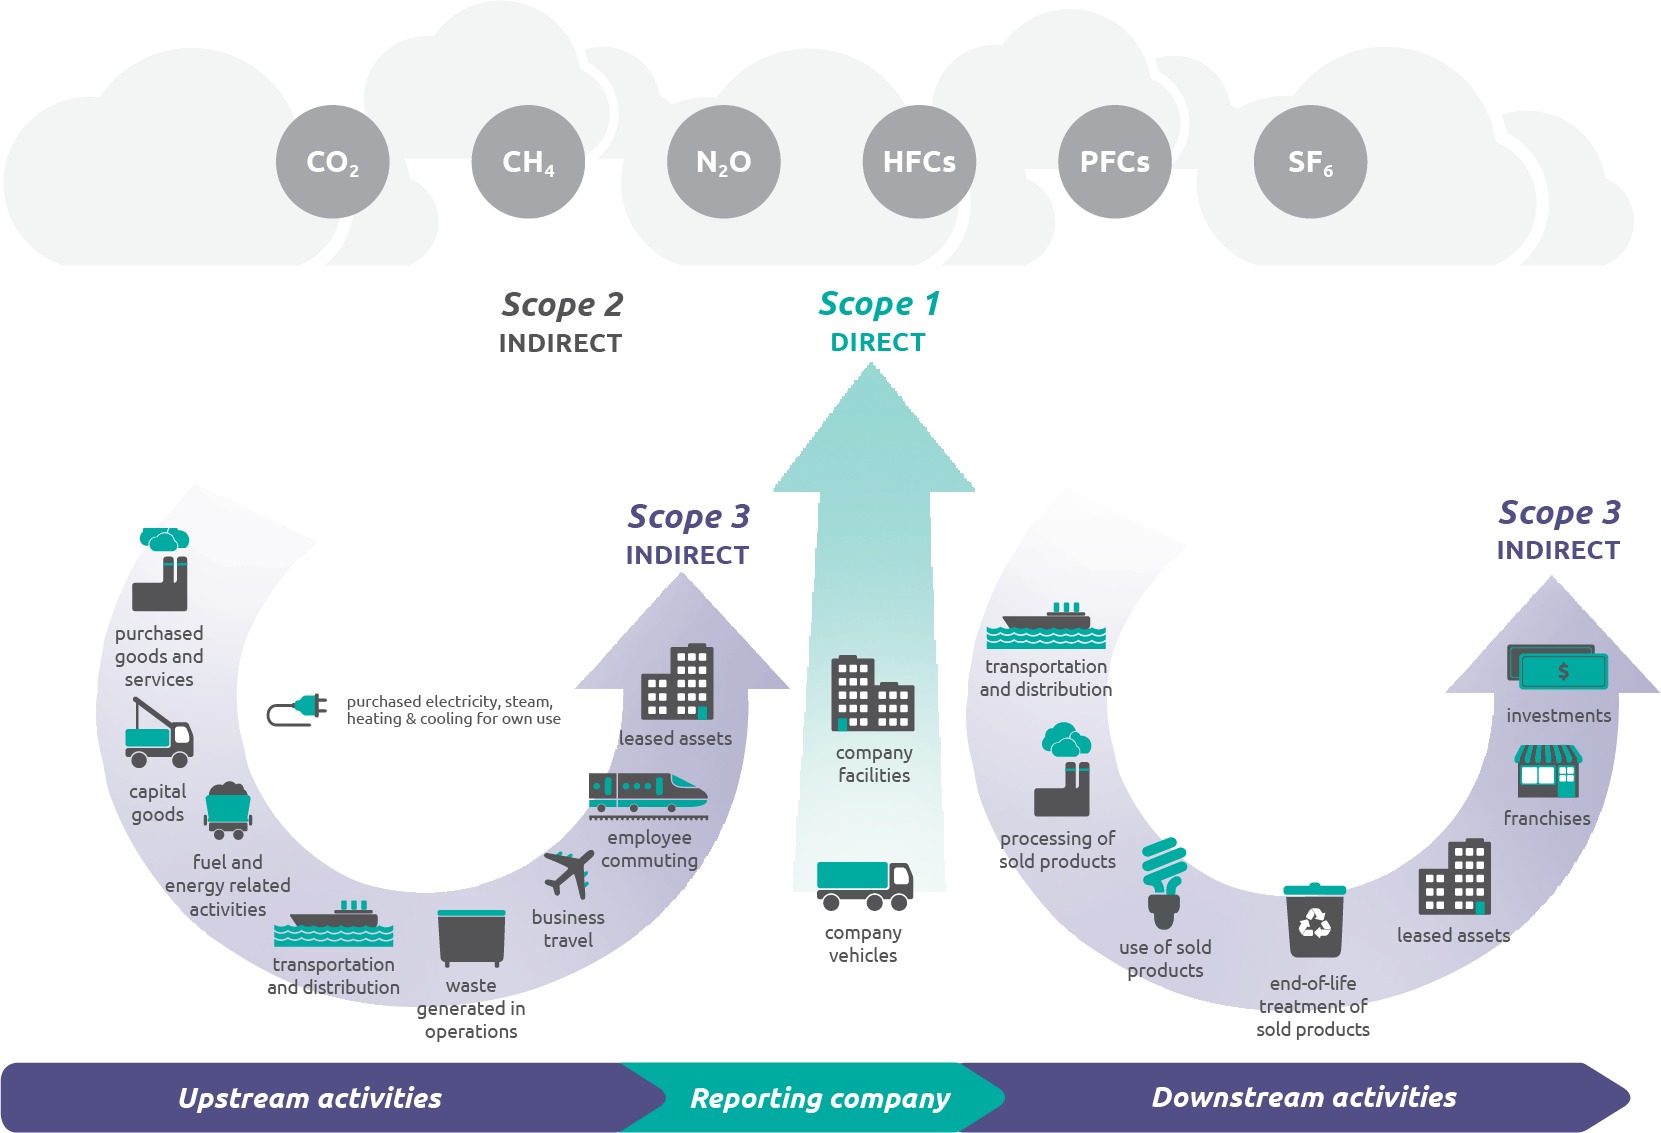
By targeting scope 1 emissions first, which primarily result from carbon fuels used in mine equipment, underground mine operators can begin to reduce emissions from this category by as much as 50%, and do it much sooner.
In this technical paper, originally presented at Caving 2022 by Colin Eustace, Polymathian head of simulation, and Scott Mariager, OZ Minerals long-term planning specialist, discuss how they used a simulation model developed by Polymathian to compare operating strategies for electrified block cave mines.
Indroduction
Carrapateena is a copper-gold mine, which is owned by OZ Minerals, located approximately 160 km north of Port Augusta in South Australia’s highly prospective Gawler Craton region. The Carrapateena mine is currently producing 4.25 Mtpa from the upper levels of an underground a sublevel cave (SLC). Development of lower levels of the SLC is ongoing while the upper levels are in production.
Development for an expansion to a 12 Mtpa production rate from 2029 is currently underway, by utilising block caving for the lower portion of the orebody. The defined footprint of the block cave portion of the orebody is approximately 310 m wide and 430 m long. Given the distribution of high-grade material within the block cave portion of the orebody, the footprint has been split into two portions, BC1 and BC2. The BC1 portion of the footprint is approximately 310 m wide and 270 m long.
Access to the block cave footprint will be via two declines, with one for access and the other being utilised for a materials handling (conveyor). Once the block cave footprint has been established, run-of-mine (ROM) material from the drawbells will be trammed to a central, off-footprint tipple that feeds into an underground crushing station. The crushing station will consist of a coarse ore bin, apron feeder, jaw-gyratory crusher, crushed ore bin, and tramp metal removal before being transported to the surface crushed ore stockpile via the main conveyor system.
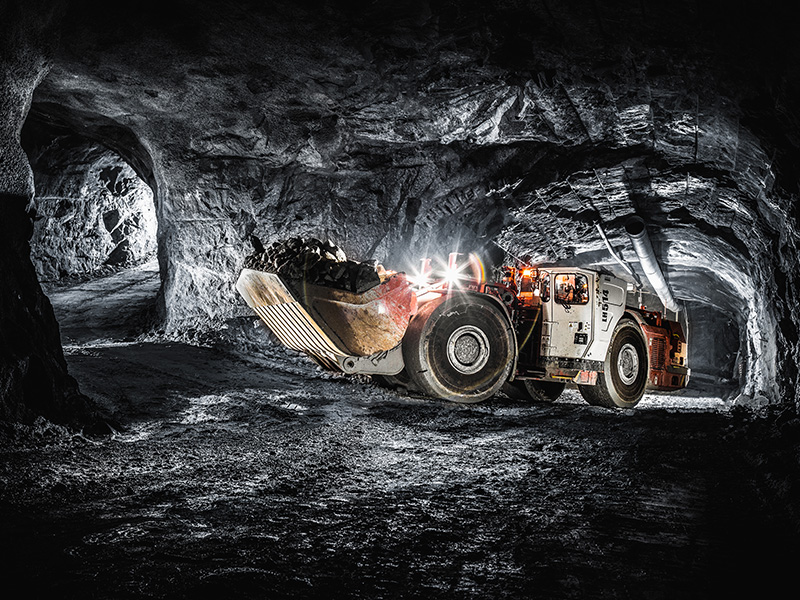
The pre-feasibility study (PFS) for the Carrapateena block cave expansion identified 21 t diesel loaders as the preferred means of achieving 12 Mtpa production output from the block cave footprint. Through its Decarbonisation Roadmap (OZ Minerals 2022), OZ Minerals aims for its current operating assets to reduce Scope 1 emissions by 50% by 2027, relative to a FY21 baseline, with a medium-term commitment of net zero emissions by 2030. Scope 1 refers to emissions produced directly by operations, primarily resulting from combustion of various fuels (OZ Minerals 2022). The electrification of the materials handling system to reduce reliance on diesel equipment will form a significant part of this reduction, as will the commencement of trials of zero emissions equipment. These measures will also help to inform a pathway to reducing remaining operational emissions.
The block cave production level operations will form a significant part of the Carrapateena underground mining activities. Given that the baseline PFS assumption for the production level was to utilise a diesel loader fleet, re-evaluation of the current designed block cave footprint and operating strategy was necessary. The re-evaluation considered the electrification options available for underground mobile equipment, to enable the Carrapateena block cave operation to meet the priorities which have been set out in the Decarbonisation Roadmap.
OZ Minerals and Polymathian conducted an initial analysis of production level operations for the Carrapateena block cave as part of the PFS for the expansion to a 12 Mtpa production rate. The findings for that study indicated that reaching the full production target was likely to require modifications to the production level design and operation strategy.
Polymathian was then engaged to perform several operational simulations on the base case footprint design, as well as various alternative footprint designs and operating strategies. Alternative equipment, fleet size and other scenario parameters were varied to determine whether the combination was capable of reaching production targets. The design inputs to this analysis were a set of three different footprint designs catering for four operating strategies with either battery electric loaders or a combination of battery electric loaders operating in conjunction with battery electric trucks. Estimated performance for battery electric loaders of varying sizes were also provided, along with historical performance data, to inform the simulation model input assumptions. Further detail is provided in Section 2.3.
The objective of the simulation analysis was to evaluate the relative performance of alternative footprint designs and operating strategies at the target production level. Use of detailed simulation analysis ensured that interactions between loaders and effects on operational performance was appropriately accounted for, and bottlenecks or areas of concern on the footprint were identified.
Conclusion
The results of the simulation comparison have shown that there are several alternative combinations capable of meeting a throughput of 12 Mtpa for the Carrapateena block cave with a battery electric equipment fleet. The alternative footprint designs, operational strategies and equipment fleet combinations show potential for meeting the decarbonisation of footprint activity’s objective while maintaining production at target levels. Based on the set of operating parameters for the Carrapateena block cave, in terms of footprint dimensions, tipple locations etc., several of these design options outperform a typical loader to tipple operational methodology that is often employed in a block cave mining operation.
Despite the increase in overall tramming distance, Option 2 provides a sound solution in meeting the 12 Mtpa throughput, without the requirement for a significant increase in additional development expenditure when compared to the base case design, which may result in a negative impact to schedule or a noticeable increase in mobile fleet size. Additionally, this option provides an efficient means for increasing throughput beyond production targets notwithstanding other potential system constraints such as the capacity of the underground crushing station. The Option 2 design also allows the optionality to start with and/or return to a more conventional loader to tipple configuration. Alternatively, a combination of both the EXT loop operating strategy (Option 2) and the conventional drawpoint to tipple operating strategy (Option 1), could be implemented (the Option 1/2 hybrid scenario), subject to the prevailing operating parameters over the life of the operation.
Further work is required to ensure the chosen footprint design option can be supported from a ventilation, scheduling, ground support, etc. point of view, as well as a consideration for the impact of interaction with ancillary equipment on the footprint.
The operating strategies developed and tested for the study have shown the potential to provide significantly increased throughput for both existing block caving operations and future developments, particularly where the width of the orebody limits the number of EXTs. In some cases, throughput increases may be able to be achieved by increasing the LHD fleet without changes to the extraction level network. In addition to increased throughput, operational flexibility is afforded by allowing more equipment to operate effectively in an area of focus on the production level. Refinements to the operating strategies tested may enable additional capacity increases, such as refining the tipple layout to minimise LHD interactions or developing a variant with ore passes at each end of the extraction level.
It is important to note that the accuracy of the results of the simulation are highly dependent on the accuracy of the input assumptions, and an appropriate amount of rigour should be applied when confirming these assumptions prior to input into a simulation model. It is also worth noting that different operating strategies may be more effective at different stages of the life of a block cave operation.
This paper has demonstrated the importance of considering the performance of a range of footprint design options and alternative operating strategies when developing a block cave mine and how simulations are an effective tool to complete this analysis.