Show me the data, and I’ll show you the value
Imagine you are on a long-haul flight and heading into the 18th hour when the familiar voice of the captain crackles over the intercom, "Ladies and gentlemen, this is your captain speaking. We've managed to catch a tailwind and are one hour ahead of schedule, Cabin prepare for landing.”
Most of us might think “Thank god! Lucky that tail wind was blowing our way!” In actual fact, it is far more likely your “lucky break” was at the hands of an advanced data analytics system making millions of calculations a second to get you to your destination faster. Making the right flight path decisions not only results in happier passengers but has a direct impact on reducing operating and maintenance costs. Airline companies are leveraging their treasure trove of data to improve profit margins daily, and here's the best part, so can you.
Business has been using data to analyse patterns of current and future trends and study the effect on their bottom line for a very long time. Think back to the early 1900s when Frederick Taylor optimised the Ford Model T assembly line by recording and analysing labourer body movements and production techniques to revolutionise the manufacturing industry worldwide.
What data, where?
Whether you realise it or not, your business accumulates massive amounts of data every day. From customer profiles in your CRM system to financial trend reporting, employee behaviours, website analytics, survey results, billing records, asset productivity reports, freight classifications, the list is endless.
In fact, the sheer volume of data we accumulate as a global community is staggering. Did you know for every hour a car spends on the road 25GB (gigabytes) of data is generated? Or for every 30 minutes of flight time, a Boeing jet engine collects 10TB (terabytes) of information that can provide answers to a host of questions.
A few years ago Eric Schmidt, Google’s then Executive Chairman caused a commotion when he stated that we create as much data every two days, as was created from the beginning of human civilisation to the year 2003.
Understanding the power of data analytics
In 2017 the Economist claimed that data had replaced oil as the world’s most valuable resource. Yet unlike oil, data can be easily extracted, and its supplies and applications are endless.
Consider our airline company again - in order to make 300 scheduled flights daily, requiring 80 aircraft, 270 cockpit crew and 400 cabin crew, you are looking at over 2.5 billion decisions! Plus planes can’t be split, staff must return to a designated home depot, crews must conform to industry fatigue standards, resulting in highly complex relationships between variables.
Data Science helps us examine these raw data to draw conclusions and support our decision making. Businesses worldwide are embracing this powerful tool and using data analytics to find answers to four main questions: ‘What has happened’, ‘Why did it happen’, ‘What will happen next’ and ‘What should happen?’.
With so much data available, it can be difficult to know what type of analytics solution you should be using. Let’s break down the four main types of data analytics and look at how they could help your business.
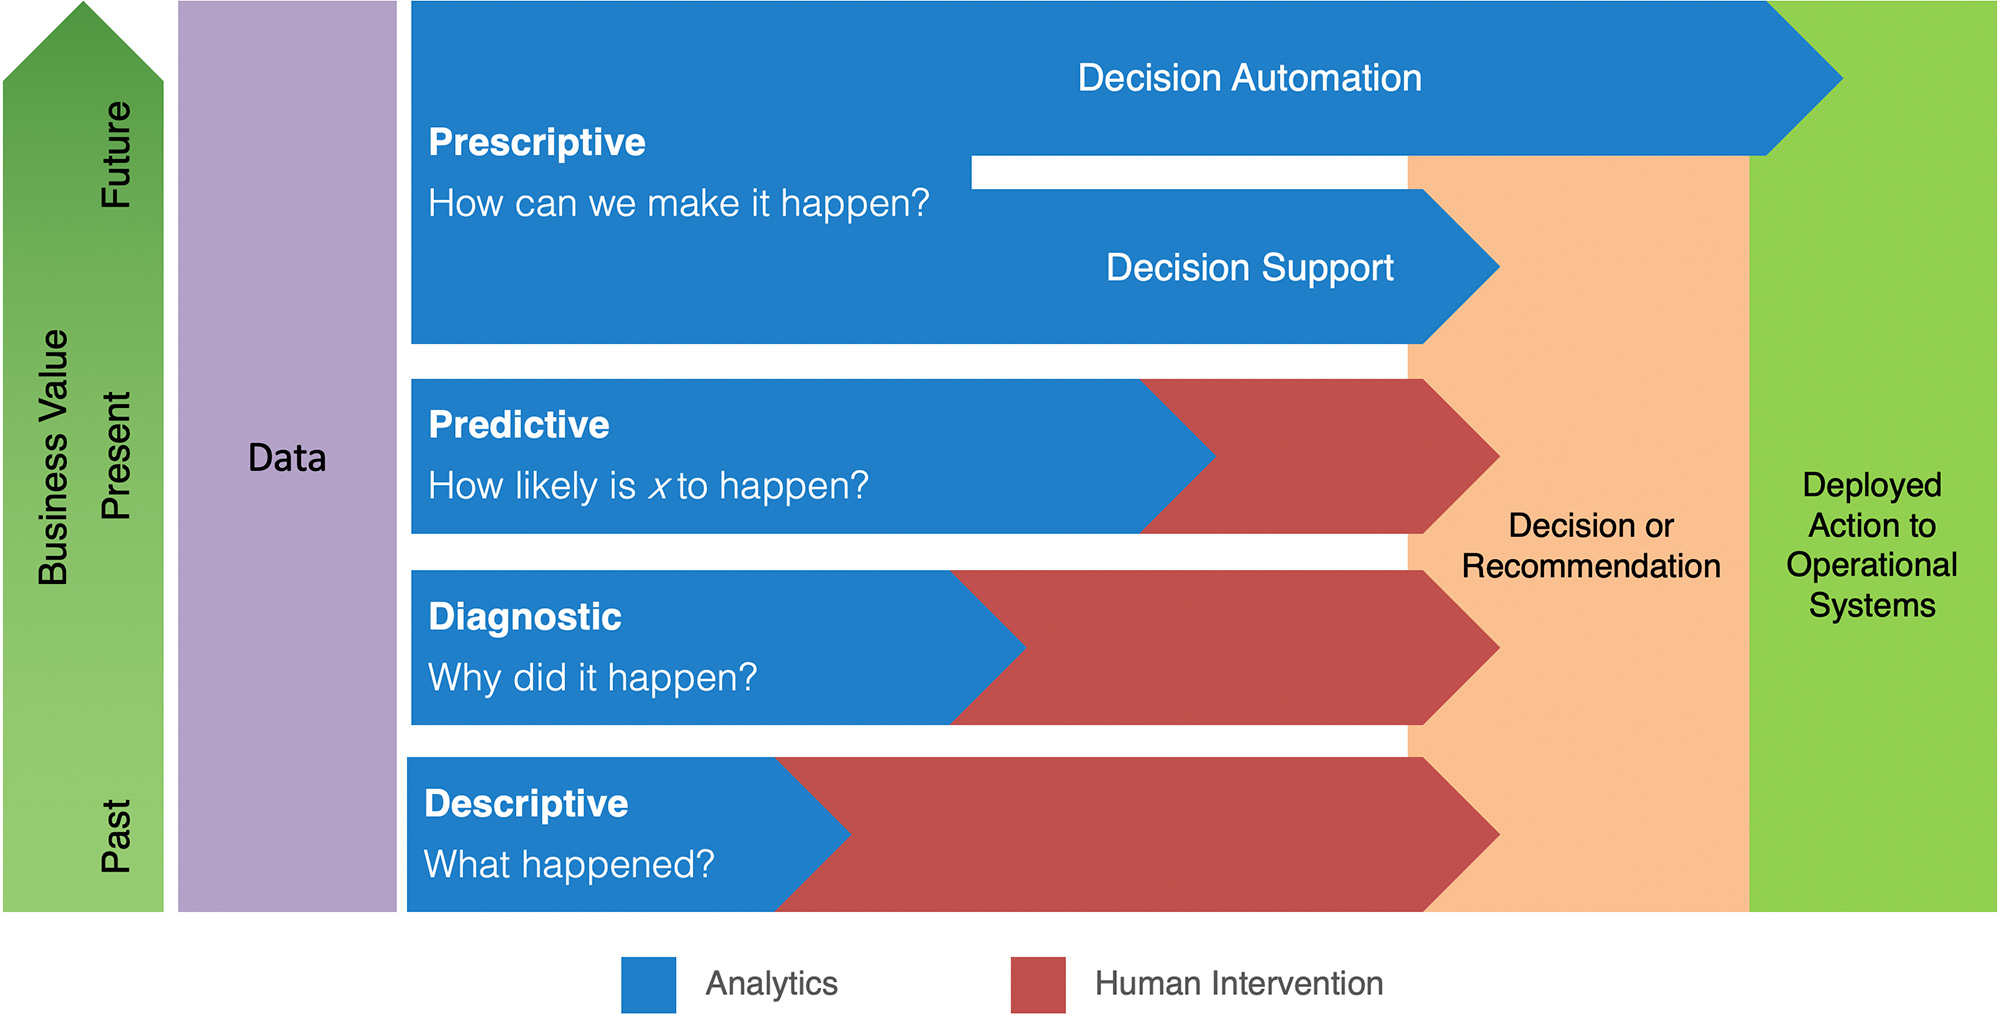
Descriptive Analytics - What has happened?
Typically, businesses everywhere apply this analysis in some form using everyday business intelligence (BI) tools and looking at data such as their financial and sales records.
Questions you might ask include “what impact did substituting contractors for full-time staff have on our bottom line?”, or “which product attracted the most sales in a particular region?”. Answers provided by your data could guide you to more targeted marketing campaigns or making adjustments to the types of employees you hire.
Diagnostic Analytics – Why did it happen?
Where descriptive analysis looks at what has occurred, diagnostic analytics look at why something has happened. The “why” tells us where to focus our efforts when fixing a problem.
Online merchants might use diagnostic analytics to determine the cause for abandoned shopping carts. Understanding that your web-based shop is poorly designed with a frustrating user experience and as a result costing you money is important.
The power of WHY is significant across all industries. From helping farmers understand what is causing mortality rates among stock levels, to discovering why construction-related spending might be at 10% of the GDP while the industry is only generating a 1 or 2 percent productivity gain.
Yet so far, we have only looked at fixing issues that have already occurred or are currently occurring. The real money lies in predicting the future.
Predictive Analytics – What will happen next?
Predictive analytics is an advanced methodology using statistical analysis, modelling, optimisation, and machine learning techniques to anticipate what will happen next.
Some years ago, a marketing communications company opened a logistics division to offset the costs of its shipping costs. With a potential 700 shipping routes, its challenge was to optimise freight costs. Using machine learning and analytics, data scientists tested thousands of scenarios across all routes until it was able to anticipate shipping rates 7 days in advance at a 99% accuracy rate. By enabling businesses to forecast potential outcomes, predictive analytics empowers them to better manage operations, supply chains and inventories to achieve greater savings.
Prescriptive Analytics – What should happen?
Your GP prescribes medication based on their knowledge and training, consideration of symptoms, your medical history, other medications you are currently taking, your allergies, and a multitude of other factors. A prescription is a suggested best course of action to remedy a problem. This is true of prescriptive analytics.
Going beyond simply predicting outcomes, prescriptive analytics suggests a range of actions relevant to a specific problem by examining their consequences to recommend the best possible solution.
A driverless car is an example of prescriptive analytics in action. As with a human driver, the vehicle must make millions of calculations on every trip to help it decide when and where to turn, how fast to travel, how to avoid crashing, and so on...
For Newcrest Mining, a gold and copper producer, it meant increasing mining efficiency by 20% using real-time optimisation software driven by prescriptive analytics that instructed its trucks where to go, in what order to dump material for processing, and where and when to mine the gold.
Prescriptive analytics enables companies in all sectors to identify and mitigate risk to future productivity and profitability. This kind of insight and foresight takes business intelligence to unprecedented levels.
Unlocking the true value of data
There is no doubt that technical advances although beneficial, come with a cost. On its own, data has little value to your company, in fact it may cost you to collect, manage and store it. Plus any business that has been through a digital transformation over the past decade may well be wary of new digital tools or analysis, given the high costs in both man hours and expenditure of previous projects.
Yet the truth is we are no longer capable of making good decisions without analytical tools to assist in understanding the important and often complex relationships between all of the data we collect. In the shipping and manufacturing sectors alone, it has been estimated that there are over 1.7 billion machine-to-machine wireless connections generating data. Without the help of sophisticated tools, we are ill-equipped to reveal the valuable lessons to be gained from all this data. You may well retain a fondness for the handy excel spreadsheet, yet consider how it performs against sophisticated forms of data analytics which have been able to impact a company’s bottom line by between 10-30%.
To unlock the true potential of your business, you need to think beyond your traditional approach – by upgrading your BI tools, you can fundamentally change your business. The questions you ask yourself each day, such as “how do we fix this?”, will become “what happens if we do this?”. And the real power of this question is how quickly you can know the answer. Things that might have taken your team many hours, days or even weeks to discover can be in your hand in minutes.
To get started, all you need is a problem to solve. What knowledge about the past will help you to make better decisions for the future?
Next, you’ll need data. This can come from many sources so it’s important you’ve clearly outlined your problem upfront. To prepare the data, you’ll need the help of someone who understands both the data and the problem - work with a suitable data analyst or industrial mathematics team who understands your industry and can build and refine the appropriate models.
Given this will obviously take both time and money, it is important that the problem you choose to solve is something which will significantly impact your business operations and profitability.
An investment in advanced analysis by a good data science team is capable of achieving tangible results in a matter of weeks or months. This relative speed with which you will see proof of value will undoubtedly build confidence in further business intelligence initiatives.
The true value of data is in its application to anticipate and plan for the future. With ROI expectations of at least a 10% increase in profit margins, choosing to go down the data analytics path is just good business. Show us the data and we will show you where the value is.